Toggle navigation
Josh Madison
About
Archives
Featured
Photos
Convert
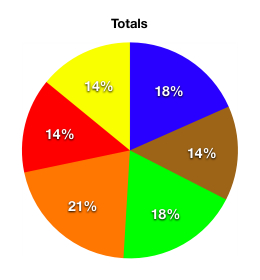
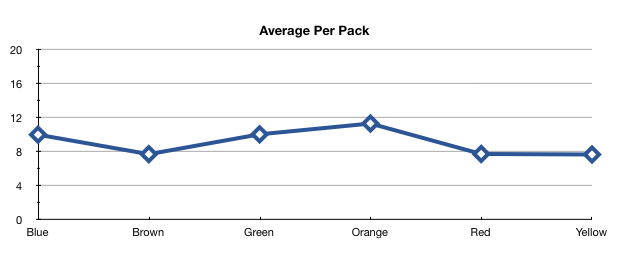
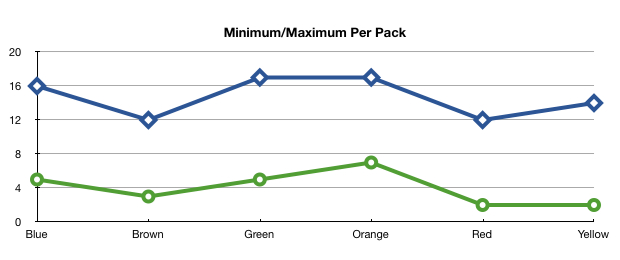
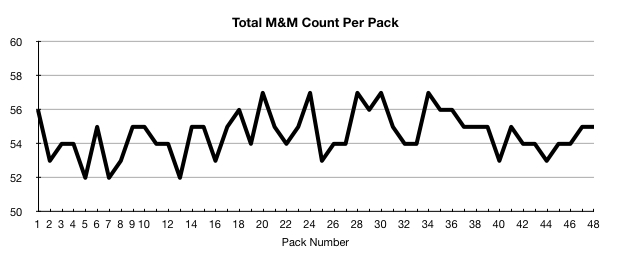
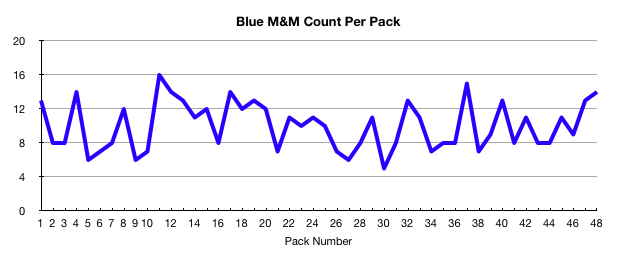
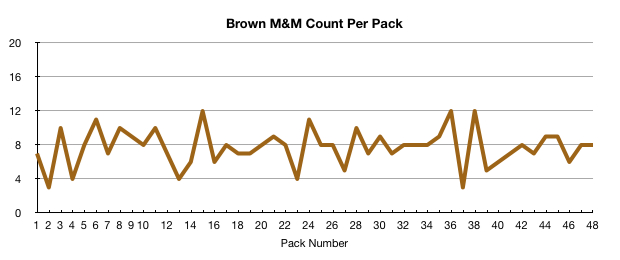
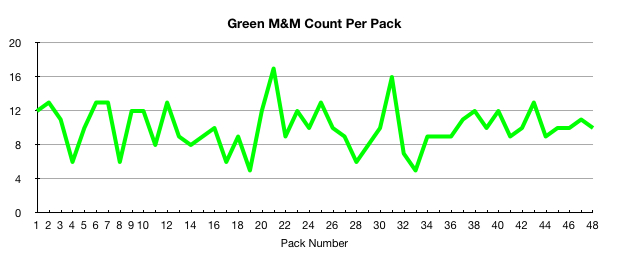
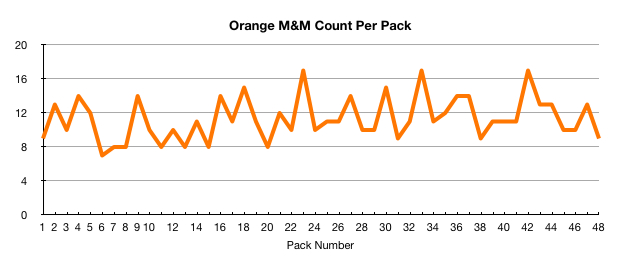
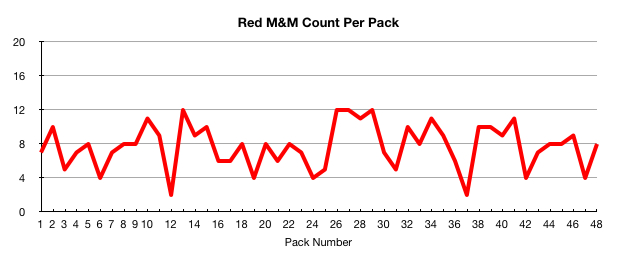
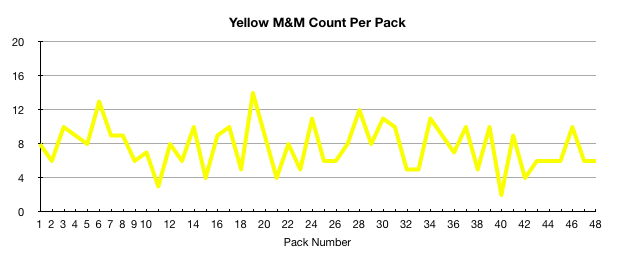
M&M’s Color Distribution Analysis Graphs
Below are some graphs of
M&M Color Distribution Analysis.
Dec 2, 2007
Back to top