Table of Contents
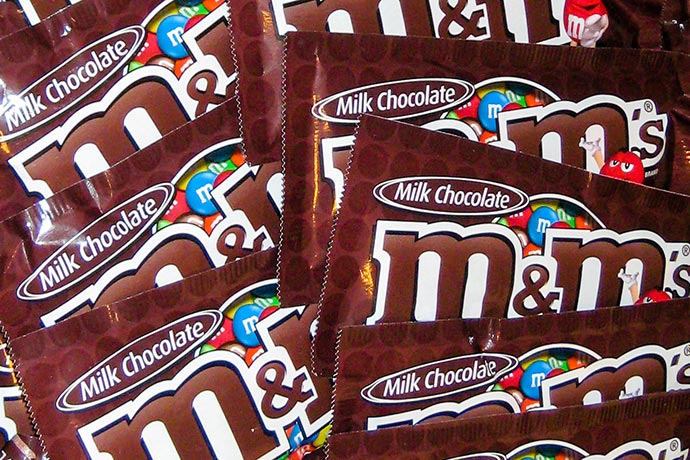
I love M&M’s. I’m partial to the plain Milk Chocolate variety, but I’ve been known to have a Peanut from time to time in order to remind myself why I don’t like them that much. Often, while eating a pack, I’ll wonder how they’re made and how the colors are distributed.
I once took a factory tour at Ben & Jerry’s and saw that they make ice cream by making one flavor per production run and then storing them to be shipped out later. While that kind of production makes sense for ice cream, since there are many different flavors and each flavor has many different ingredients, it doesn’t make sense for M&M’s since, except for the color of the candy shell, they are all the same. I assume that all the different colors are made at the same time and they’re combined together along the way into the different size packages.
After wondering about it a little more, I checked out M&M’s web site. According to it, each package of Milk Chocolate M&M’s should contain 24% blue, 14% brown, 16% green, 20% orange, 13% red, and 14% yellow M&M’s. I checked the next few packages of M&M’s that I ate and found that their percentages were not even close to the stated distribution. In my mind, this sort of confirmed my thoughts about how they produce M&M’s: When they make M&M’s, in any production run, they produce the stated percentage of each color and then just fill the packs off a conveyor line or some other weight based method. This would mean that any single package could be way off from the stated percentage; but analyze the counts over a large number of packages, and they should converge towards the stated percentages.
That’s what I aim to do here.

Overview
I thought about taking a random sampling of packs by grabbing many different packs from different locations, but I ruled this out because it was entirely possible that I would just get the packages that were way off the stated percentages. In addition, they would all be from different production runs and that alone would skew the numbers a bit, and to get a true representative sampling, I’d have to purchase a whole boatload of them. Instead, I decided to get a single “case” of M&M’s since I would be assured that all inside came from the same production run.
M&M’s that are sold at retail come in a cardboard box containing 48 packages of M&M’s. After acquiring a “case”, I counted each package for the total number of M&M’s in the package. Next I counted each color, and then compared the sum of all the colors in each pack to the total of the pack as a form of error checking. All numbers were entered into a database to allow for easy analysis of the data.
Summary results
48 packages of M&M Milk Chocolate 1, containing a total of 2620 M&M’s, were used in this project. On average, each package had 55 M&M’s.
| Blue | Brown | Green | Orange | Red | Yellow | Total | |
|---|---|---|---|---|---|---|---|
| Percent expected | 24% | 13% | 16% | 20% | 13% | 14% | ––– |
| Percent observed | 18.36% | 14.16% | 18.44% | 20.76% | 14.20% | 14.08% | ––– |
| Qty. expected | 629 | 341 | 419 | 524 | 341 | 367 | ––– |
| Qty. observed | 481 | 371 | 483 | 544 | 372 | 369 | 2620 |
| Difference | -148 | +30 | +64 | +20 | +31 | +2 | ––– |
| Average per pack | 10.02 | 7.73 | 10.06 | 11.33 | 7.75 | 7.69 | 54.58 |
| Maximum in pack | 16 | 12 | 17 | 17 | 12 | 14 | 57 |
| Minimum in pack | 5 | 3 | 5 | 7 | 2 | 2 | 52 |
| Std. deviation | 2.82 | 2.19 | 2.59 | 2.54 | 2.62 | 2.65 | 1.32 |
| Variance | 1.74 | 7.98 | 4.80 | 6.70 | 6.44 | 6.87 | 7.03 |
The quantity expected row is based on the total numbers of M&M’s observed and calculated using the percent expected values from M&M’s web site.
Blue, the most populous color according to M&M, was observed to be the third most populous color, and was almost 25% less than it’s expected amount.
Brown, orange, red, and yellow were all within two percentage points of their expected quantities, with yellow coming closest.
After analyzing all the individual pack’s data, it seems like pack #22 is the closest to M&M’s published numbers, as well as being the most “average” pack in this project.
Each individual pack’s data is listed on a separate page.
This single case does not prove anything, but it does show that some colors were close enough to verify M&M’s claims, while others were off. A second case should be analyzed to confirm the findings.
All M&M’s were brought to my office and donated to sugar deprived co-workers.
Graphs
- All packages were 1.69 ounces and were from the same 48-count box. This is the standard newspaper stand/vending machine size. ↩
